TechCrowd
Infographic
Brief:
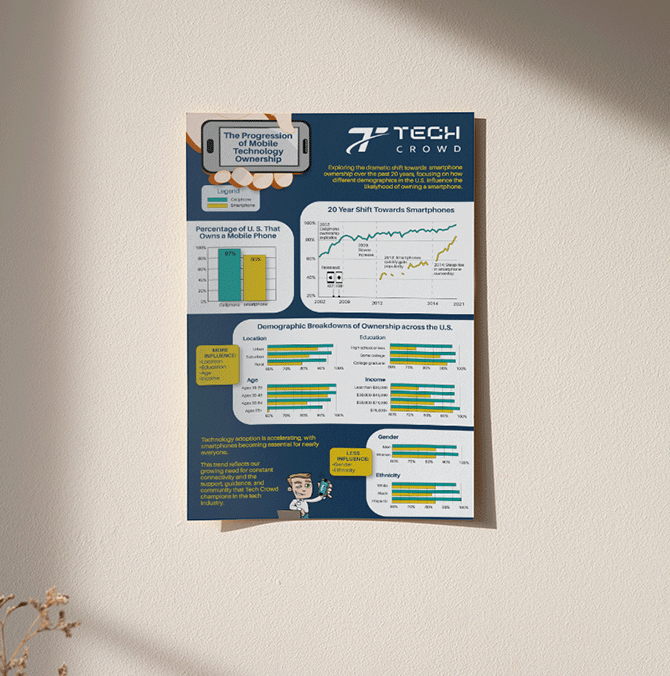
Create an infographic that visualizes the progression of mobile technology ownership over the past two decades, with a focus on smartphone adoption and demographic differences.
The project required analyzing a large dataset provided in Excel and translating it into a clear, engaging visual narrative. I used Excel to organize and interpret the data, then built and styled each chart in Adobe Illustrator,
carefully applying brand colors, typography, and layout principles from Tech Crowd’s style guide.
The final design balances clarity and visual impact, guiding viewers through trends in ownership and highlighting the challenges some populations face in a tech-driven world.